NEW CLIENT ONBOARDING

By
Dhruv
The Complete Guide to Measuring Onboarding Performance, KPIs & Success
Why Most Onboarding Programs Fail, and How Data Changes That
Picture a typical Monday at your SaaS agency. A new enterprise account, let's call the buyer Alex, signs on after a strong sales call. Your team sets up a welcome kit, books a kick-off call, and hands off to the onboarding specialist.
By day ten, Alex's message lands in your inbox: "We're pausing due to setup challenges." A $75,000 contract is gone. Not because your product failed. Because nobody measured what was happening until it was too late.
This story repeats itself across thousands of B2B teams every quarter. The fix is not to hire more CSMs or redesign the product. The fix is knowing which numbers to watch and acting early enough to respond.
This guide covers every customer onboarding KPI worth tracking in 2026: what each metric means, how to calculate it, the benchmarks that separate good from great, and practical steps to move your numbers in the right direction.
Book a demo and see how it works
What Are Customer Onboarding Metrics?
Customer onboarding metrics are quantitative and qualitative signals that reveal how well your organisation guides new customers from first login or first project kickoff to sustained, confident use of your product or service.
Think of them in three layers:
1: Speed & Efficiency, how fast customers move through the process
2: Engagement, how actively they interact along the way
3: Outcomes & Business Health, what happens to revenue, loyalty, and growth
Together, these layers give you a 360-degree view of onboarding performance. No single metric tells the full story. A short Time to First Value means little if completion rates are low. A high NPS post-onboarding is empty if feature adoption stays flat six months later.
Learn how top teams expand accounts
2026 Onboarding KPI Quick Reference
KPI | What It Measures | 2026 Benchmark |
Time to First Value (TTFV) | Days from sign-up to first meaningful outcome | < 7 days (B2B) |
Time to Complete Onboarding (TTO) | Total duration from start to fully configured | 3–10 days |
Onboarding Completion Rate | % of starters who finish all onboarding steps | ≥ 85% |
Avg Response / Resolution Time | Speed of support during the onboarding window | < 2 hrs / < 1 day |
Activation Rate | % who reach the defined 'aha moment' | ≥ 60% |
Feature Adoption Rate | % actively using core features post-onboarding | ≥ 60% |
Customer Effort Score (CES) | Perceived ease of getting started (1–7 scale) | ≤ 2 / 7 |
CSAT (Onboarding) | Satisfaction with the onboarding experience (1–5) | ≥ 4.4 / 5 |
Early Churn Rate | % who cancel during or shortly after onboarding | < 10% |
NPS Post-Onboarding | Likelihood to recommend after the onboarding phase | ≥ 50 |
Customer Lifetime Value (CLV) | Projected total revenue per customer | ↑ 20–30% with strong onboarding |
Upsell / Cross-sell Conversion | % who upgrade or add services post-onboarding | 15–25% |
Section 1: Speed & Efficiency Metrics
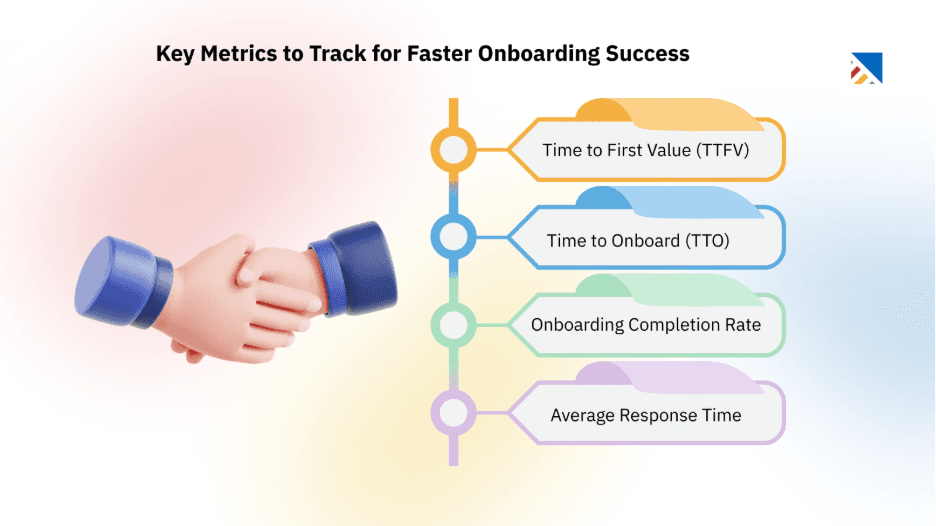
Speed metrics answer one question: are customers reaching value before patience runs out?
In a world where 75% of users abandon a product if they can't grasp its value within the first week, pace is everything.
1. Time to First Value (TTFV):
Time to First Value measures the number of days between a customer signing up and their first tangible 'aha' outcome. For a project management tool that might be their first successfully closed task. For a data platform, it might be their first automated report.
Why it matters
TTFV is the strongest predictor of early engagement. Customers who see value fast build habits quickly, while those who don’t often churn early. Teams track TTFV as the key signal separating long-term retention from early drop-off.
B. How to calculate it:
TTFV = Date of first meaningful milestone − Signup date 1-1 |
Log both dates in your CRM or onboarding platform. Define 'first milestone' clearly before you start measuring; vague definitions produce misleading numbers.
C. How to improve it
Pre-fill account templates so customers start with real data, not blank slates
Add visible progress indicators: 'You are 3 steps from your first insight'
Replace long onboarding questionnaires with progressive profiling over the first week
Assign a named CSM for accounts above a revenue threshold; direct human guidance cuts TTFV faster than any automation
Reduce time-to-value, book demo
2. Time to Complete Onboarding (TTO)
TTO measures the total calendar time from purchase or first login to the customer completing all required onboarding steps. Where TTFV marks the first spark of value, TTO marks the point where a customer is fully set up and self-sufficient.
Why it matters
A long TTO creates a risky gap; customers feel stuck without ROI and begin exploring alternatives. Shorter TTO closes that gap quickly.
B. How to calculate it
TTO = Onboarding completion date − Onboarding start date |
Use funnel analytics to break TTO down by stage. Knowing that 60% of your delay lives in the 'integration setup' step is far more useful than knowing the average total is 11 days.
C. How to improve it
Break onboarding into daily tasks with a visible checklist, one firm cut TTO 40% with this change alone
Automate reminders for overdue steps rather than waiting for customers to ask
Please identify your top three bottleneck stages using funnel drop-off data and address those first.
3. Onboarding Completion Rate
Completion rate is the percentage of customers who start onboarding and complete all mandatory steps or training modules.
Why it matters:
Incomplete onboarding is costly. Customers who don’t finish setup see less value, churn more, and require more support. Programs with 85%+ completion rates achieve roughly double the 12-month retention compared with those below 50%.
B. How to calculate it
Completion Rate = (Customers who completed all steps ÷ Customers who started) × 100 |
C. How to improve it
Audit every step and remove anything that can wait until Month 2
Offer live chat or in-app support at the exact steps where most drop-offs happen
Segment your process by customer type; enterprise buyers often need white-glove steps that confuse SMB users
Send automated nudges when a user goes 48 hours without progressing
4. Average Response & Resolution Time
This metric measures two things: how quickly your team responds to onboarding support requests (response time) and how quickly those issues are fully resolved (resolution time).
Why it matters
Customers in B2B onboarding are in an anxious state. They've just spent budget and political capital on a buying decision. A 24-hour wait on a critical question does not just delay setup; it damages trust in a way that persists long after the ticket is closed.
B. How to calculate it
Response Time = Average time from ticket creation to first agent reply |
Resolution Time = Average time from ticket creation to marked resolved |
Track both in your helpdesk (Zendesk, Intercom, HubSpot Service) and filter specifically for tickets raised within the first 30 days of onboarding.
C. How to improve it
Build a self-service knowledge base targeting the 10 most common onboarding questions
Deploy chatbots for routine queries so human agents focus on complex cases
Set SLAs specifically for onboarding tickets and give them a higher queue priority
Download: How the Best B2B Teams Expand Enterprise Accounts with Onboarding
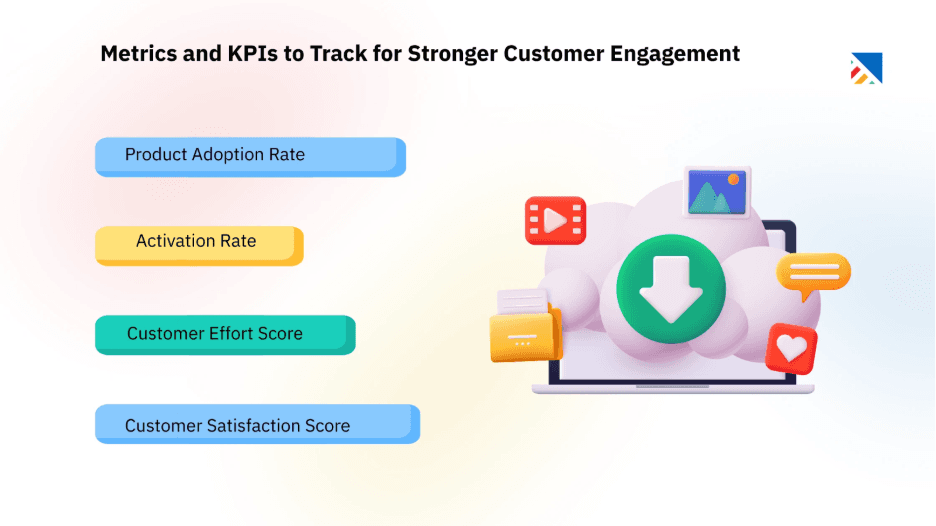
Section 2: Engagement Metrics
Engagement metrics answer a subtler question: are customers actively invested in the process, or just going through the motions? A customer who clicks through 10 steps without reading is not engaged; they are enduring. These metrics help you tell the difference.
5. Activation Rate
Activation rate measures the percentage of new customers who reach the specific milestone your team has defined as the 'aha moment', the point at which a customer has experienced enough core value to form a product habit.
Why it matters
Activation connects onboarding to retention. Customers who don’t activate rarely convert or renew, and rates below 50% signal a mismatch with sales expectations.
B. How to calculate it
Activation Rate = (Customers who reached activation milestone ÷ Total new customers) × 100 |
Your activation milestone must be product-specific and measurable. 'Feeling comfortable' is not an activation event. 'Ran first automated report' or 'invited first team member' is.
C. How to improve it
Use product analytics to identify which early actions correlate most strongly with 90-day retention, that is, your activation event.
Send timed in-app prompts at the moments most likely to trigger activation
Segment outreach by company size, enterprise accounts often need additional touch points compared with SMB self-serve users
Start better onboarding today. Book a demo
6. Feature Adoption Rate
Feature adoption rate tracks what percentage of new customers regularly use your core features after onboarding is complete. It separates customers who are logging in from customers who are genuinely getting value.
Why it matters
Low feature adoption predicts churn later (Months 6–12). Customers using only ~20% of the product start considering alternatives, while 60%+ core feature adoption helps prevent churn.
B. How to calculate it
Feature Adoption Rate = (Users actively using a specific feature ÷ Total active users) × 100 |
Calculate this for each core feature separately. A blended adoption number masks which specific features are being left behind.
C. How to improve it
Add contextual in-app tooltips that appear the first time a user could logically benefit from a feature
Personalise onboarding paths by use case, a marketing user and a finance user need to see different core features first
Track adoption by cohort, not just in aggregate; cohort data reveals whether improvements are actually sticking
7. Customer Effort Score (CES)
CES measures how much effort a customer had to exert to complete B2B onboarding tasks or resolve issues. It is collected via a simple post-task survey: 'How easy was it to get started today?' on a 1–7 scale, where 1 is very easy.
Why it matters
Effort is a stronger predictor of churn than satisfaction. A customer who found your product enjoyable but difficult is more likely to leave than a customer who found it merely adequate but effortless. CES surfaces friction before it turns into a cancel request.
B. How to calculate it
CES = Average of all survey responses (1–7 scale) |
Send the survey immediately after key onboarding tasks, integration setup, first report creation, and first team invite. Timing matters; surveys sent days after the fact capture memory, not experience.
C. How to improve it
Simplify any step that scores consistently high effort
Add inline tooltips and progress guides at friction-heavy moments
Run brief usability tests with new customers, watching someone go through setup reveals issues that no survey question will surface
From deal to delivery, Start a Free Trial
8. Customer Satisfaction Score (CSAT), Onboarding Specific
CSAT captures direct satisfaction with the onboarding experience, usually via a short survey sent at the end of the onboarding phase or after a key interaction: 'How satisfied are you with your onboarding experience so far?' on a 1–5 scale.
Why it matters
Onboarding CSAT is an early churn signal. Scores below 3/5 often lead to disengagement within 90 days. Track it separately to isolate onboarding issues.
B. How to calculate it
CSAT = (Number of satisfied responses [4 or 5] ÷ Total responses) × 100 |
Always include an open-text 'Why?' field. Scores without a qualitative context are difficult to act on.
C. How to improve it
Follow up on every score below 4 within 24 hours
Look for patterns in the open-text field, common phrases like 'confusing' or 'took too long' are action items, not noise
Celebrate high CSAT scores with the onboarding team; positive reinforcement shapes process culture
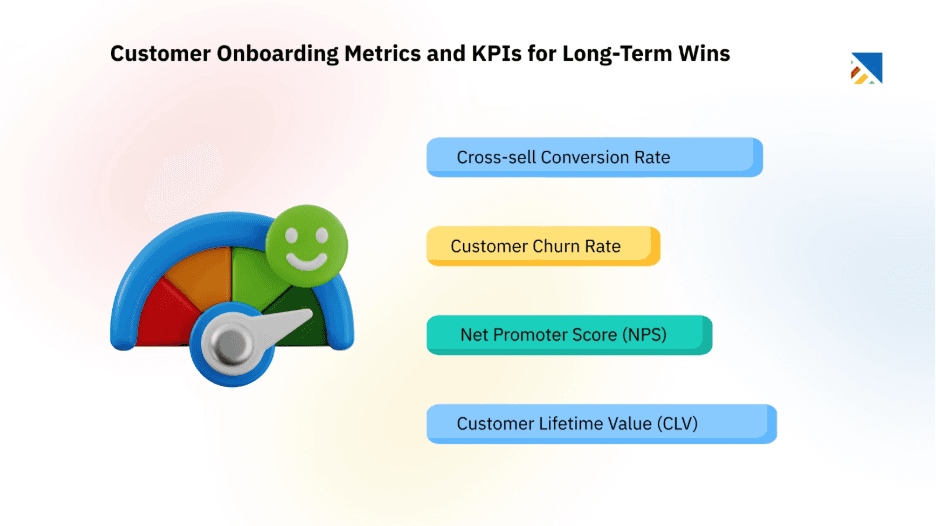
Section 3: Outcome & Business Health Metrics
Outcome metrics are what the boardroom cares about. They connect onboarding process improvements directly to revenue, retention, and long-term growth. These are the numbers you present in quarterly business reviews to demonstrate that onboarding is not a cost centre, it is a growth driver.
9. Early Churn Rate
Early churn rate tracks the percentage of new customers who cancel or disengage during onboarding or within the first 90 days. It is the most direct measure of onboarding failure.
Why it matters
Early churn is 5× more expensive than later churn because you have incurred the full cost of acquisition and onboarding with zero return on investment. Poor onboarding consistently ranks in the top three reasons customers cite for early cancellation.
B. How to calculate it
Early Churn Rate = (Customers who churned in first 90 days ÷ Total new customers onboarded) × 100 |
Segment by acquisition source, customer size, and onboarding cohort. Raw blended churn numbers hide which segments are healthy and which are critical.
C. How to improve it
Build a structured 30-day check-in call into every onboarding programme
Create a health score combining TTFV, activation, feature adoption, and support tickets, and flag accounts at risk before they cancel
Offer short trial extensions to accounts that are making genuine progress but need slightly more time.
Fix your handoff gaps, get in touch
10. Net Promoter Score (NPS) Post-Onboarding
Post-onboarding NPS captures how likely new customers are to recommend you based specifically on their onboarding experience, collected at the moment they complete the onboarding phase while the experience is still fresh.
Why it matters
NPS above 50 signals strong organic growth. If NPS drops after onboarding, the product is the issue; if it rises, onboarding is the problem.
B. How to calculate it
NPS = % Promoters (score 9–10) − % Detractors (score 0–6) |
|---|
C. How to improve it
Share customer success stories and case studies during onboarding to build enthusiasm and aspiration
Act visibly on Detractor feedback, customers who see their feedback implemented become unlikely but powerful advocates
Monitor NPS trends by cohort; a declining NPS across recent cohorts is an early signal that a process change is not working.
11. Customer Lifetime Value (CLV)
CLV is a forward-looking metric that estimates the total net revenue a business can expect from a single customer account over the entire relationship. Customer Onboarding is one of the strongest levers for increasing it.
Why it matters
Well-onboarded, highly engaged customers deliver ~3× more value. Strong onboarding boosts CLV by 20–30% by reducing churn and driving expansion.
B. How to calculate it
CLV = (Average annual revenue per customer × Average customer lifespan in years) − Customer acquisition cost |
Calculate by acquisition cohort so you can isolate the CLV impact of specific onboarding process changes.
C. How to improve it
Introduce upsell conversations during onboarding, not as a sales pitch, but by showing value gaps the customer has not yet explored
Use CLV projections to justify investment in premium onboarding resources for high-value accounts
12. Upsell / Cross-sell Conversion Rate
This metric tracks the percentage of newly onboarded customers who upgrade their plan, add a seat, or purchase an adjacent service within the first six months, a direct signal of how well onboarding communicated product depth.
Why it matters
Engaged customers spend ~60% more per transaction. A 15–25% upsell/cross-sell rate in the first six months signals onboarding is driving demand for more value.
B. How to calculate it
Upsell Conversion Rate = (Customers who upgraded or added services ÷ Total customers onboarded) × 100 |
C. How to improve it
Highlighting premium features or adjacent products at natural moments in onboarding, after a customer achieves their first milestone, is ideal
Train CSMs to document expansion signals during onboarding check-ins and pass them to account managers.
Building Your Onboarding Metrics Stack in 2026
You do not need enterprise software on day one. The best customer onboarding analytics programme is the one you will actually use consistently. Here is a practical build sequence:
Start: Spreadsheet baseline (Month 1): Use a shared Google Sheet to manually track TTFV, completion rate, and early churn for your next 20 customers. This forces your team to agree on definitions before investing in tooling.
Scale: Mid-tier platforms (Months 2–6): Platforms like Gainsight, ChurnZero, Totango, and Planhat offer onboarding-specific dashboards, health scores, and automated alert systems. Most have free trials and tiered pricing that scales with your customer count.
Optimise: Product analytics (Ongoing): Tools like Amplitude, Mixpanel, and Heap give you event-level visibility into activation and feature adoption. Connect these to your CRM so behavioural data informs CSM outreach automatically.
Start simple, scale smart, track, optimise, and improve onboarding. Start your free trial →
Five operational habits that matter more than the tools
Set baselines before running experiments; you cannot measure improvement without a starting point
Automate alerts for early churn signals: a customer going 5+ days without logging in during onboarding should trigger an immediate outreach
Review onboarding metrics in weekly team standups; monthly is too slow to catch problems before they compound
Tie at least one team incentive to an onboarding KPI, so it is not purely an analytics exercise
Pair quantitative KPIs with qualitative customer quotes; the number tells you something is wrong; the quote tells you why
Frequently Asked Questions
How many onboarding metrics should I track?
Start with four: TTFV, completion rate, activation rate, and early churn. These four collectively cover speed, engagement, and outcomes. Add metrics as your team develops the operational capacity to act on them, tracking 12 metrics you cannot act on is less useful than tracking 4 you can.
How does onboarding affect the overall customer journey?
Onboarding sets the emotional and behavioural baseline for the entire customer relationship. Customers who onboard well are more likely to renew, expand, refer, and engage with new features. Every downstream customer success metric, NPS, retention, CLV, is partially determined by what happens in those first 30–90 days.
What is the difference between activation rate and completion rate?
Completion rate measures process adherence: Did the customer finish the steps? Activation rate measures value attainment: Did the customer reach the outcome that those steps were designed to deliver? A customer can complete every onboarding checklist item without ever activating. Both numbers matter, but activation is the more meaningful signal.
Which onboarding tool is best for measuring these KPIs in 2026?
It depends on your stage. Early-stage: Mixpanel or Amplitude for product events plus a CRM. Growth-stage: Gainsight or ChurnZero for dedicated CS workflows. Enterprise: purpose-built platforms with health scoring, automated playbooks, and integration with your data warehouse. Free trials are widely available; test against your specific KPI requirements before committing.
How do I get my team bought in on tracking onboarding metrics?
Connect the metrics to consequences that matter to each stakeholder. For CSMs: fewer escalations and better renewal rates. For leadership: revenue impact of churn reduction. For product: clear evidence that specific features are (or are not) driving activation. The easiest buy-in comes from showing the data for a real account that churned and walking the room through exactly which metric would have flagged the problem two weeks earlier.
Start your free trial of Projetly
The Bottom Line
Onboarding metrics are not a reporting obligation. They are the operational system that lets you find problems while they are still fixable, prove the business value of customer success investment, and build the kind of early experience that turns first-time buyers into long-term advocates.
The teams winning in 2026 are not necessarily the ones with the most sophisticated tools. They are the ones who have agreed on what good looks like, put the right numbers on a dashboard where the whole team can see them, and created a weekly habit of asking 'what does the data say we should do next?'
Start with four metrics. Set your baselines. Run your first experiment. Measure again. The compounding effect of small, data-informed improvements to your onboarding experience is one of the highest-ROI investments available to any B2B customer success organisation today.
You may also like

A Guide to Project Management Professional Certification

Laugh Your Way to Productivity: 50 Workplace Quotes

50 Funny Workplace Memes That’ll Brighten Your Workday.

What Does a Customer-First Mindset Mean? Explained in 2025

What It Takes to be a Great Customer Success Manager in 2025

